ADL
ADL Overview
ADL Basic Concepts
Description
Reference
Task
Advanced concepts
Case Studies
Task
説明
Building your first algo
Lessons
Introduction to ADL
Reference
Task
Videos
説明
Arithmetic blocks
Basic blocks
Discrete blocks
Group blocks
Jump blocks
Library blocks
Logic blocks
Miscellaneous blocks
Trading Blocks
Virtualized blocks
APIs
TT .NET SDK
Advanced Concepts and Options
Appendix
Creating the application framework
Getting started with TT .NET SDK
Subscribing for market data
More about prices
An in-depth look at the Price class
Working with Algos
Algo Server
TT Order Types
TT Premium Order Types
Working with instruments
Working with orders and fills
Handling trade subscriptions
Working with trade subscriptions
TT CORE SDK
Appendix
Creating a TT Application Server
Creating Application Framework
Getting Started with TT Core SDK
Subscribing for Market Data
Working With Instruments
Working with Orders and Fills
TT REST API 2.0
API Reference
Getting Started
TT REST API 2.0 (UAT)
API Reference
Getting Started
Data and Analytics
TT Margin
MiFID II Support
Monitor
Setup
Company Administration
Account Administrators
Task
説明
Accounts
Reference
Task
Use Cases
Videos
説明
Advanced Features
説明
Company
Reference
Task
説明
Connections
Description
Reference
Task
Videos
Order Tag Defaults
Description
Task
TT Access
Description
Task
TT Premium Services
Description
Task
Users
Description
Reference
Task
Videos
Exchanges: Americas
B3
Description
Task
CBOE
Description
Task
Cboe FX
Description
Reference
Task
CFE
Description
Task
CME
Description
Task
Dealerweb
Description
Task
EBS Direct
Description
Task
EBS Market
Description
Task
Fenics
Description
Task
FMX
Description
Task
FMX_USTF
Description
Task
Goldman Sachs Commodity Blocks (GSCB)
Description
Referece
Task
ICE
Description
Task
MexDer
Description
Task
MIAX_FUT_CH
Description
Task
MIAX_FUT_NY
Description
Task
MX
Description
Task
NFI
Task
Nodal
Description
Task
Exchanges: Asia/Pacific
ABX
Description
Task
ASX
Description
Task
CoinFLEX
Task
FEX
Description
Task
HKEx
Description
Task
JPX
Description
Task
NSE
Description
Task
NZX
Description
Task
SGX
Description
Task
SGX GIFT
Description
Task
TAIFEX
Description
Task
TFEX
Description
Task
TFX
Description
Task
Exchanges: Crypto
Coinbase
Description
Task
Kraken
Description
Task
Exchanges: EMEA
ATHEX
Description
Task
BIST
Description
Task
CEDX
DGCX
Description
Task
EEX
Description
Task
EPEX SPOT
Description
Reference
Task
Eris
Description
Task
Eurex
Description
Task
Videos
Euronext
Description
Task
GFO-X
Description
Task
ICE_L
Description
Task
JSE
Description
Task
LME
Description
Task
LME NTP
Description
Task
LSE
Description
Task
MEFF
Description
Task
NASDAQ_NED
Description
Task
NDAQ_EU
Description
Task
Nord Pool
Description
Reference
Task
WSE
Description
Task
FIX Support
FIX Ruleset
Description
Task
FIX Sessions
Description
Task
Secondary Accounts
Description
Task
Risk Management
KRM Limits
Description
Task
Order Cross Prevention
Description
Task
Videos
Pre-Trade Portfolio Risk
Description
Reference
Task
Risk Administration
Description
Task
Risk Limits
Description
Reference
Task
Videos
Setup Overview
Getting Started
Description
Reference
Task
Videos
Supported Order Types and TIFs
TT® OMS
TT OMS Administration
Description
Reference
Task
Use Cases
TT Backtesting
TT FIX Services
TT FIX Drop Copy In
Overview
Supported application messages
TT FIX Drop Copy Out
Compliance Feed messages
Overview
Supported application messages
TT FIX Message Conversations
TT FIX Gateway
Components
FIX Message Structure
Getting Started
Order Gateway Messages
Price Gateway Messages
Session messages
TT FIX General
FIX Message Structure
Getting Started
Session messages
TT FIX Market Data
Overview
Supported application messages
TT FIX message conversations
TT FIX Order Routing
Overview
Supported application messages
TT FIX message conversations
TT FIX Recovery
Compliance Feed Messages
FIX Recovery Methods
Overview
Supported application messages
TT Mobile
TT Mobile on Android
Entering Orders
Getting Started
Monitoring Trade Activity
Viewing Markets
TT Mobile on iOS
Entering Orders
Getting Started
Monitoring Trade Activity
Viewing Markets
TT Trade Surveillance
Cluster View
Configurable Models
Core Models
Cross Product Models
Improperly Matched Trade Models
Market Abuse Models
Market Rate Models
Miscellaneous Models
Spoofing Models
Trading Behaviors Models
Overview
Reference
Reports
Using TT Trade Surveillance
Wachlists
取引
Analytics
Charts
Description
Reference
Task
Technical Indicators
Videos
Trader Analytics
Description
Reference
Task
Basic Order Entry
Blocktrader
Description
Reference
Task
Videos
MD Trader®
Description
Reference
Task
Videos
Order Profiles
Description
Reference
Task
Order Ticket
Description
Reference
Task
Use Cases
Routing Rules
Description
Task
Trading Crypto on TT
Description
Reference
Task
Videos
Trading on B3
TT Order Types
Case Studies
Description
Reference
Task
Videos
TT Premium Order Types
Description
Reference
Task
Options
Counterparty Manager
Description
Task
Electronic Eye
Description
Reference
Task
Videos
Expiration Manager
Description
Task
Options Chain
Description
Reference
Task
Use Cases
Videos
Options on TT
Description
Videos
Options Risk
Description
Reference
Task
Videos
Options Risk Matrix
Description
Reference
Task
Videos
Options Trade Monitor
Description
Reference
Task
Videos
QuikStrike
Description
Task
RFQ Viewer
Description
Reference
Task
Videos
RFQ with Counterparties
Description
Task
Strategy Creation
Description
Reference
Task
Use Cases
TT Uncovered
TT Uncovered 2.0
Description
Task
TT Uncovered 3.0
Description
Task
Vol Curve Manager
Description
Reference
Task
Use Cases
Videos
Volatility Calculator
Description
Task
Watchlist
Description
Reference
Task
Videos
Order Management
Account & User Restrictions
Description
Reference
Task
Account List
Description
Reference
Task
Videos
Alert Manager and Alert Viewer
Description
Reference
Task
Videos
Audit Query
Description
Reference
Task
Audit Trail
Description
Reference
Task
Balances
Description
Reference
Task
Fills
Description
Reference
Task
Floating Order Book
Description
Reference
Task
Order Book
Description
Reference
Task
Orders and Fills
Description
Reference
Task
Position Manager
Description
Reference
Task
Positions
Description
Reference
Task
Overview
Browser Access
Description
Task
Videos
Preferences
Description
TT Desktop
Description
Reference
Task
Videos
TT Platform
Description
Task
Widgets
Description
Task
Workspace Windows
Description
Task
Videos
Spread Trading
Aggregator
Description
Reference
Task
Videos
Autospreader
Description
Reference
Task
Use Cases
Videos
Autospreader Rules
Description
Reference
Task
Videos
Hedge Manager
Description
Reference
Task
Videos
Trading in Yield
Description
Reference
Task
Use Cases
TT® OMS
Bulking
Description
Task
Videos
Care Orders
Description
Reference
Task
Videos
Combining
Description
Task
Lock and Release
Description
Task
Order Exceptions
Description
Task
Order Passing
Description
Task
Use Cases
Stitching and Splitting
Description
Task
Viewing Market Data
Depth
Description
Reference
Task
Market Grid
Description
Reference
Task
Videos
Product Grid
Description
Reference
Task
Spread Matrix
Description
Reference
Task
Videos
Time and Sales
Description
Reference
Task
アルゴ取引
Algo Dashboard
Reference
Task
Videos
説明
Autotrader
Description
Reference
Task
Videos
Excel integration with TT
Description
Reference
Task
Videos
Market-Making Algos
Order Management Algos (OMAs)
Template Manager
Description
Task

Floor/Ceiling

On this page

Floor/Ceiling model detects a pattern of trading activity intended to maintain the price of an instrument during the trading session. The pattern reflects an attempt to prevent the instrument price from trading lower (creating a price ‘floor’) or higher (creating a price ‘ceiling’).

To keep a price from moving through a particular price level, a trader can place one order or multiple orders on one side (buy/sell) of the market at a specific price level. These orders include a significant amount of the trading volume relative to the normal amount for the instrument. This reduces the likelihood that the market will move though that price.

This approach may not result in profit within the particular instrument, however, it may be related to another position that is tied to the price of this instrument.

Scoring methodology

To detect a trader’s potential for creating a price floor or a price ceiling, TT Trade Surveillance analyzes the following data during the trading period:

  • The low and high prices for the instrument during the trading session
  • Total market volume and percent of session volume traded at the high or low price
  • Trader’s volume at the high or low price level
  • Traders percentage of volume at the high or low price level
  • Trader’s percentage of market volume at the high or low price level
  • Trader’s percentage of passive trading at the high or low level

Score interpretation

The score assigned to a cluster is based on a sliding scale between 0-100 using a weighted calculation. A score of 75 and above is a good indication that the suspect trading activity occurred.

Based on TT Trade Surveillance best practices, clusters that score over 75 are deemed to be “high risk” and should be the primary focus of users during their compliance reviews.

Scorecard metrics

The Floor/Ceiling cluster scorecard includes metrics that help you determine if price manipulation may have occurred during the trading session.

The following metrics are provided:

  • Session High — The high price for the instrument during the trading session.
  • Session Low — The low price for the instrument during the trading session.
  • Trdr Ssn Vol — The volume of trader’s activity for the session.
  • Trdr Ssn High Vol — The volume of trader’s activity that matches the instrument’s high price for the session.
  • Trdr Ssn Low Vol — The volume of trader’s activity that matches the instrument’s low price for the session.
  • Mkt Session Vol — The total trading volume for the session.
  • Trdr Ask Vol Pct Vs Trdr Ssn Vol: — The percentage of ask volume compared to the trader’s total volume for the session.
  • Trdr Vol Vs Mkt Vol — The trader’s percentage of volume for the total market volume.
  • Trdr Pct High Vol Vs Mkt Vol — The percentage of volume of trader’s activity that matches the instrument’s high price for the session versus the total market volume.
  • Trdr Pct High Vol Vs Trdr Ssn Vol: — The percentage of volume of trader’s activity that matches the instrument’s high price for the session versus the trader’s total volume for the session.
  • Trdr Pct Agg Vs Ssn Fill — Percent of trader’s aggressive trades versus the session fills.
  • Trdr High Fill Vs VAP High: — The volume of trader’s activity that matches the instrument’s high price for the session versus volume-at-price (VAP) at the same price level.
  • VAP High Prc — The percentage of volume that matches the instrument’s high price.
  • Trd Cnt High Prc — Count of fill or partial fill actions at the high/low by the trader.

Identifying Floor/Ceiling

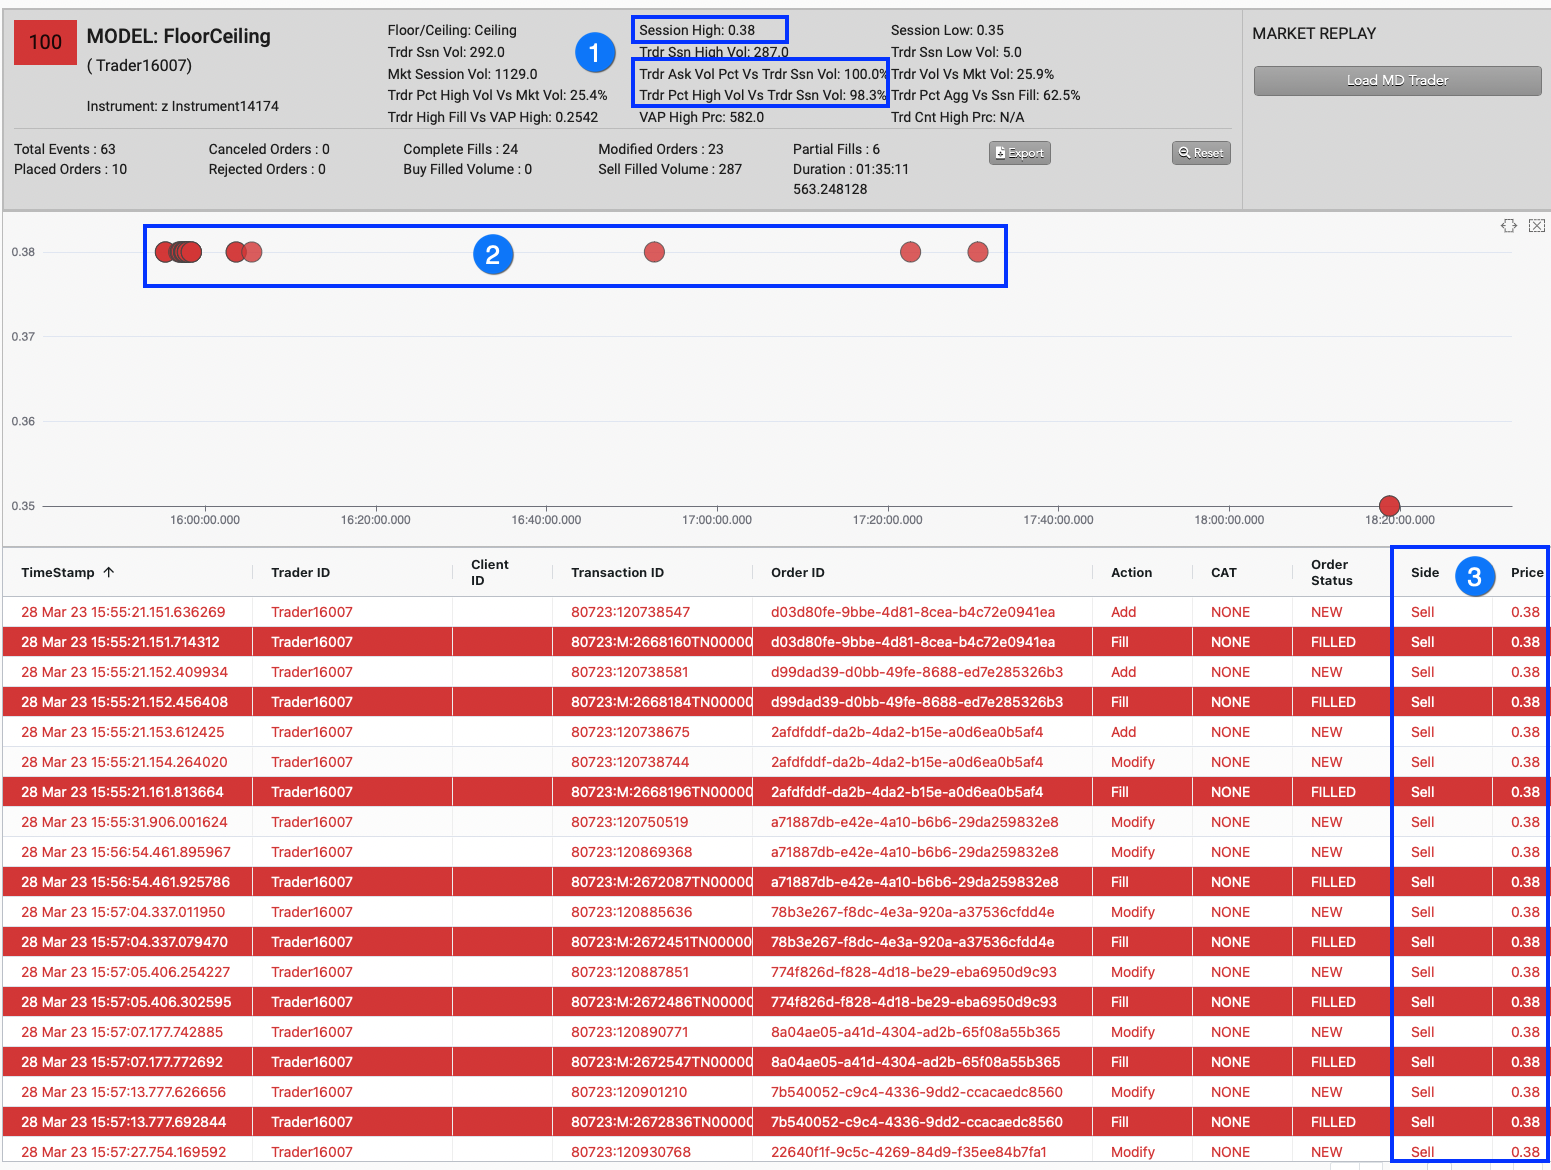
In addition to the scorecard metrics, the Floor/Ceiling chart and audit trail can also help identify suspicious trading activity. The following image shows results from inspecting a Floor/Ceiling trading cluster.

When investigating Floor/Ceiling clusters in TT Trade Surveillance, check for the following indications of potential price manipulation:

  1. Compare the trader’s ask/bid volume percentage and the percent high/low volume with the session volume.
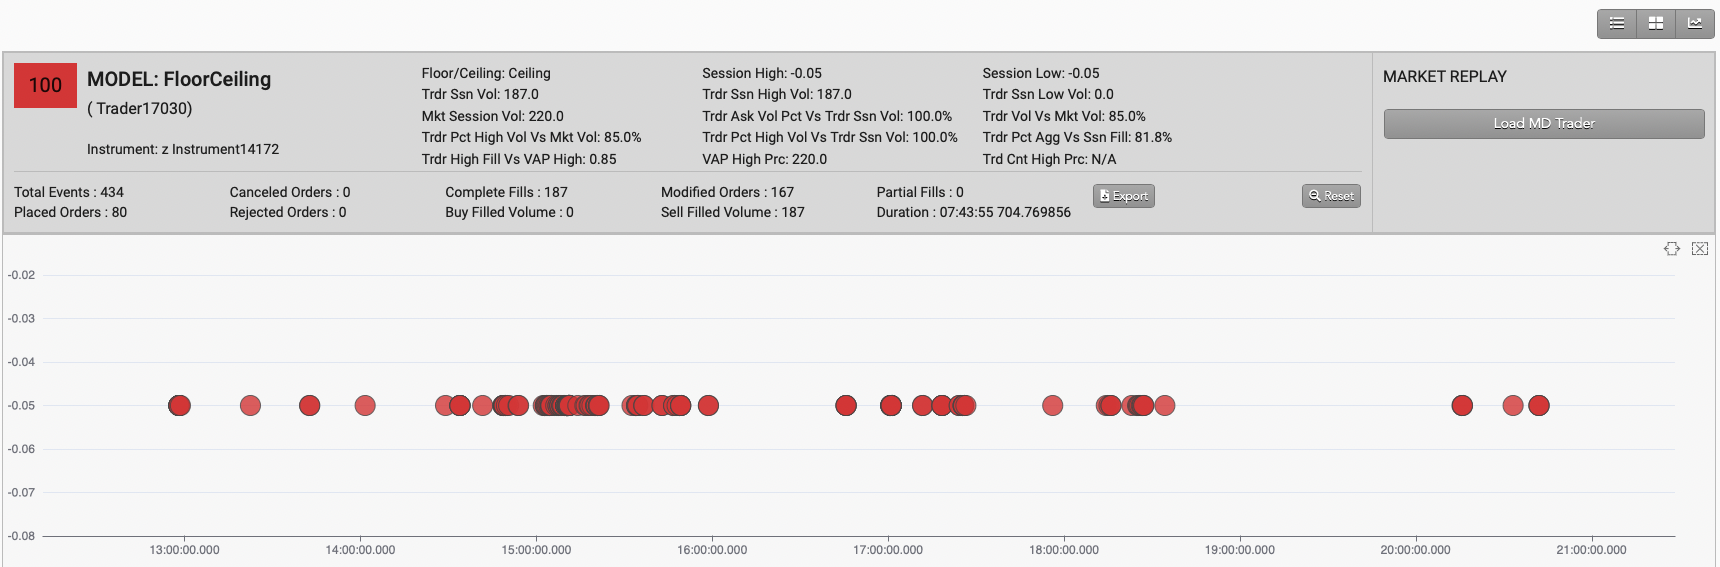
  2. In the chart, look for a high number of trades on one side (bid/ask) of the market that matches the Session high/low price level.
  3. In the audit trail, check if the trades occurred at the high/low price for the instrument.

This site is registered on wpml.org as a development site. Switch to a production site key to remove this banner.