


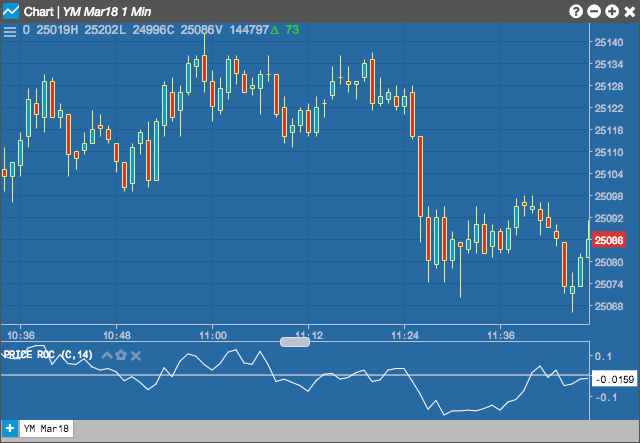
The Price Rate of Change indicator is used to identify overbought or oversold conditions. It compares the current price with the previous price from a selected number of periods ago. The current price is divided by the previous price and expressed as a percentage. The rate increases until it reaches a market specific level. Extreme rates of increase could mean that the market is overheated and in need of a pause.
Configuration Options
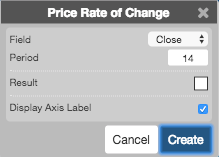
- Field: Price or combination of prices to use as the base for average calculations. Possible values include:
- Open
- High
- Low
- Close
- Adjusted Close
- HL/2 ( left ( frac{High + Low}{2} right ) )
- HLC/3 ( left ( frac{High + Low + Close}{3} right ) )
- HLCC/4 ( left ( frac{High + Low + Close + Close}{4} right ) )
- OHLC/4 ( left ( frac{Open + High + Low + Close}{4} right ) )
- Period: Number of bars to use in the calculations.
- Color Selectors: Colors to use for graph elements.
- Display Axis Label: Whether to display the most recent value on the Y axis.
Formula
[PROC = frac{CurrentPrice – Price_{n-periods ago} * 100}{Price_{n-periods ago}} -1 ]