ADL
ADL Overview
ADL Basic Concepts
Description
Reference
Task
Advanced concepts
Case Studies
Description
Task
Building your first algo
Lessons
Introduction to ADL
Description
Reference
Task
Videos
Arithmetic blocks
Basic blocks
Discrete blocks
Group blocks
Jump blocks
Library blocks
Logic blocks
Miscellaneous blocks
Trading Blocks
Virtualized blocks
APIs
TT .NET SDK
Advanced Concepts and Options
Appendix
Creating the application framework
Getting started with TT .NET SDK
Subscribing for market data
More about prices
An in-depth look at the Price class
Working with Algos
Algo Server
TT Order Types
TT Premium Order Types
Working with instruments
Working with orders and fills
Handling trade subscriptions
Working with trade subscriptions
TT CORE SDK
Appendix
Creating a TT Application Server
Creating Application Framework
Getting Started with TT Core SDK
Subscribing for Market Data
Working With Instruments
Working with Orders and Fills
TT REST API 2.0
API Reference
Getting Started
TT REST API 2.0 (UAT)
API Reference
Getting Started
Data and Analytics
TT Margin
MiFID II Support
Monitor
Setup
Company Administration
Account Administrators
Description
Task
Accounts
Description
Reference
Task
Use Cases
Videos
Advanced Features
Description
Company
Description
Reference
Task
Connections
Description
Reference
Task
Videos
Order Tag Defaults
Description
Task
TT Access
Description
Task
TT Premium Services
Description
Task
Users
Description
Reference
Task
Videos
Exchanges: Americas
B3
Description
Task
CBOE
Description
Task
Cboe FX
Description
Reference
Task
CFE
Description
Task
CME
Description
Task
Dealerweb
Description
Task
EBS Direct
Description
Task
EBS Market
Description
Task
Fenics
Description
Task
FMX
Description
Task
FMX_USTF
Description
Task
Goldman Sachs Commodity Blocks (GSCB)
Description
Referece
Task
ICE
Description
Task
MexDer
Description
Task
MIAX_FUT_CH
Description
Task
MIAX_FUT_NY
Description
Task
MX
Description
Task
NFI
Task
Nodal
Description
Task
Exchanges: Asia/Pacific
ABX
Description
Task
ASX
Description
Task
CoinFLEX
Task
FEX
Description
Task
HKEx
Description
Task
JPX
Description
Task
NSE
Description
Task
NZX
Description
Task
SGX
Description
Task
SGX GIFT
Description
Task
TAIFEX
Description
Task
TFEX
Description
Task
TFX
Description
Task
Exchanges: Crypto
Coinbase
Description
Task
Kraken
Description
Task
Exchanges: EMEA
ATHEX
Description
Task
BIST
Description
Task
CEDX
DGCX
Description
Task
EEX
Description
Task
EPEX SPOT
Description
Reference
Task
Eris
Description
Task
Eurex
Description
Task
Videos
Euronext
Description
Task
GFO-X
Description
Task
ICE_L
Description
Task
JSE
Description
Task
LME
Description
Task
LME NTP
Description
Task
LSE
Description
Task
MEFF
Description
Task
NASDAQ_NED
Description
Task
NDAQ_EU
Description
Task
Nord Pool
Description
Reference
Task
WSE
Description
Task
FIX Support
FIX Ruleset
Description
Task
FIX Sessions
Description
Task
Secondary Accounts
Description
Task
Risk Management
KRM Limits
Description
Task
Order Cross Prevention
Description
Task
Videos
Pre-Trade Portfolio Risk
Description
Reference
Task
Risk Administration
Description
Task
Risk Limits
Description
Reference
Task
Videos
Setup Overview
Getting Started
Description
Reference
Task
Videos
Supported Order Types and TIFs
TT® OMS
TT OMS Administration
Description
Reference
Task
Use Cases
Trade
Algo Trading
Algo Dashboard
Description
Reference
Task
Videos
Autotrader
Description
Reference
Task
Videos
Excel integration with TT
Description
Reference
Task
Videos
Market-Making Algos
Order Management Algos (OMAs)
Template Manager
Description
Task
Analytics
Charts
Description
Reference
Task
Technical Indicators
Videos
Trader Analytics
Description
Reference
Task
Basic Order Entry
Blocktrader
Description
Reference
Task
Videos
MD Trader®
Description
Reference
Task
Videos
Order Profiles
Description
Reference
Task
Order Ticket
Description
Reference
Task
Use Cases
Routing Rules
Description
Task
Trading Crypto on TT
Description
Reference
Task
Videos
Trading on B3
TT Order Types
Case Studies
Description
Reference
Task
Videos
TT Premium Order Types
Description
Reference
Task
Options
Counterparty Manager
Description
Task
Electronic Eye
Description
Reference
Task
Videos
Expiration Manager
Description
Task
Options Chain
Description
Reference
Task
Use Cases
Videos
Options on TT
Description
Videos
Options Risk
Description
Reference
Task
Videos
Options Risk Matrix
Description
Reference
Task
Videos
Options Trade Monitor
Description
Reference
Task
Videos
QuikStrike
Description
Task
RFQ Viewer
Description
Reference
Task
Videos
RFQ with Counterparties
Description
Task
Strategy Creation
Description
Reference
Task
Use Cases
TT Uncovered
TT Uncovered 2.0
Description
Task
TT Uncovered 3.0
Description
Task
Vol Curve Manager
Description
Reference
Task
Use Cases
Videos
Volatility Calculator
Description
Task
Watchlist
Description
Reference
Task
Videos
Order Management
Account & User Restrictions
Description
Reference
Task
Account List
Description
Reference
Task
Videos
Alert Manager and Alert Viewer
Description
Reference
Task
Videos
Audit Query
Description
Reference
Task
Audit Trail
Description
Reference
Task
Balances
Description
Reference
Task
Fills
Description
Reference
Task
Floating Order Book
Description
Reference
Task
Order Book
Description
Reference
Task
Orders and Fills
Description
Reference
Task
Position Manager
Description
Reference
Task
Positions
Description
Reference
Task
Overview
Browser Access
Description
Task
Videos
Preferences
Description
TT Desktop
Description
Reference
Task
Videos
TT Platform
Description
Task
Widgets
Description
Task
Workspace Windows
Description
Task
Videos
Spread Trading
Aggregator
Description
Reference
Task
Videos
Autospreader
Description
Reference
Task
Use Cases
Videos
Autospreader Rules
Description
Reference
Task
Videos
Hedge Manager
Description
Reference
Task
Videos
Trading in Yield
Description
Reference
Task
Use Cases
TT® OMS
Bulking
Description
Task
Videos
Care Orders
Description
Reference
Task
Videos
Combining
Description
Task
Lock and Release
Description
Task
Order Exceptions
Description
Task
Order Passing
Description
Task
Use Cases
Stitching and Splitting
Description
Task
Viewing Market Data
Depth
Description
Reference
Task
Market Grid
Description
Reference
Task
Videos
Product Grid
Description
Reference
Task
Spread Matrix
Description
Reference
Task
Videos
Time and Sales
Description
Reference
Task
TT Backtesting
TT FIX Services
TT FIX Drop Copy In
Overview
Supported application messages
TT FIX Drop Copy Out
Compliance Feed messages
Overview
Supported application messages
TT FIX Message Conversations
TT FIX Gateway
Components
FIX Message Structure
Getting Started
Order Gateway Messages
Price Gateway Messages
Session messages
TT FIX General
FIX Message Structure
Getting Started
Session messages
TT FIX Market Data
Overview
Supported application messages
TT FIX message conversations
TT FIX Order Routing
Overview
Supported application messages
TT FIX message conversations
TT FIX Recovery
Compliance Feed Messages
FIX Recovery Methods
Overview
Supported application messages
TT Mobile
TT Trade Surveillance
Cluster View
Configurable Models
Core Models
Cross Product Models
Improperly Matched Trade Models
Market Abuse Models
Market Rate Models
Miscellaneous Models
Spoofing Models
Trading Behaviors Models
Overview
Reference
Reports
Using TT Trade Surveillance
Wachlists

Reviewing Clusters Using Cluster Views

On this page

The method for reviewing clusters for problematic trading activities are unique to each type.

Spoofing

Use the Cluster Scorecard to get a closer look at the activity that triggered the spoofing score. The chart at the bottom of the scorecard can give you visual clues about the spoofing pattern. For example, the chart in the following scorecard for a cluster with a high spoofing score shows a potential flipping pattern.

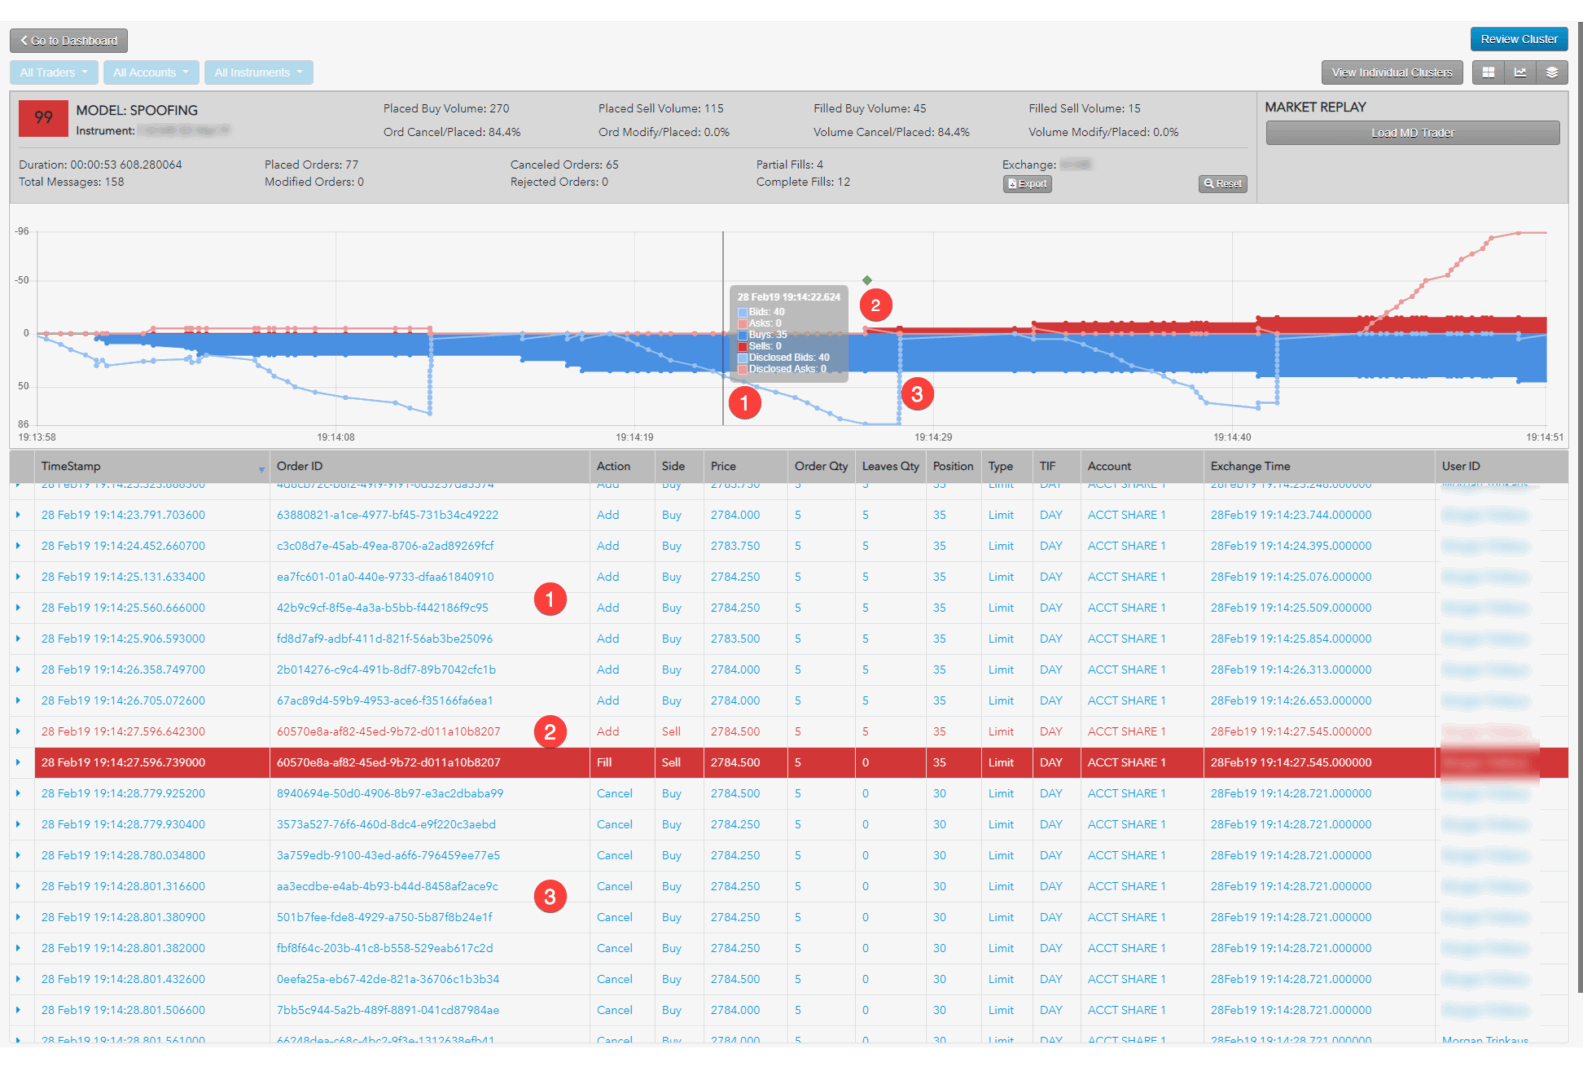
The example shows the following:

  1. Trader is adding volume on the buy side to create the appearance of buy-side pressure.
  2. Trader adds a small Sell order, which immediately fills.
  3. Trader then cancels all outstanding Buy orders.

The chart shows activity based on order volume over time, but does not show the order prices and liquidity. Looking at the prices for the potential spoofing orders can help you determine whether the trader was placing those orders far off the market in an attempt to deceive traders.

From the Cluster Scorecard, you can click Market Replay to show how the orders interacted with the market at the various price levels.

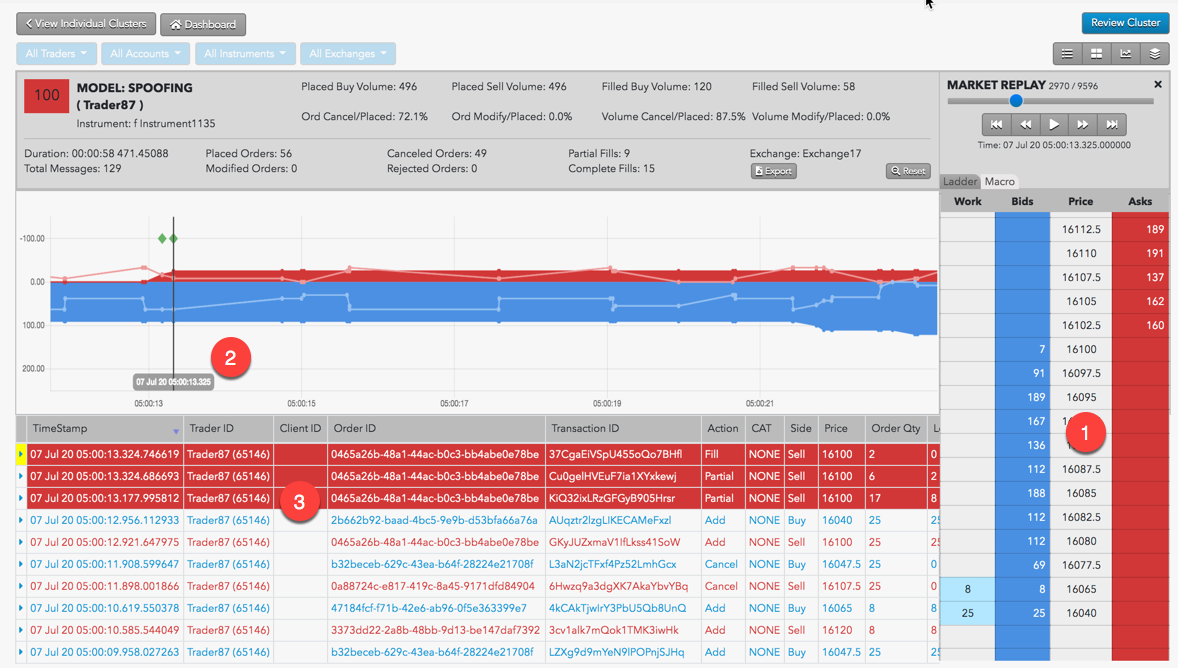
The market replay shows the following:

  1. The price ladder shows the prices and liquidity in the market during the potential spoofing activity.
  2. The vertical line identifies the point of time during the market replay.
  3. Orders and fills that occurred around the specified time during the market replay.

Abusive Messaging

Use the Cluster Scorecard to get a closer look at the activity that triggered the abusive messaging score. The Cluster Statistics and Scorecard Metrics sections of the scorecard show the:

  • Time duration of the cluster
  • Total number of messages sent
  • Percentages for different message rates

The chart at the bottom of the scorecard can give you visual clues about the abusive messaging pattern. For example, the chart in the following scorecard is for a cluster with a high percentage of high-rate messages over a very short time period.

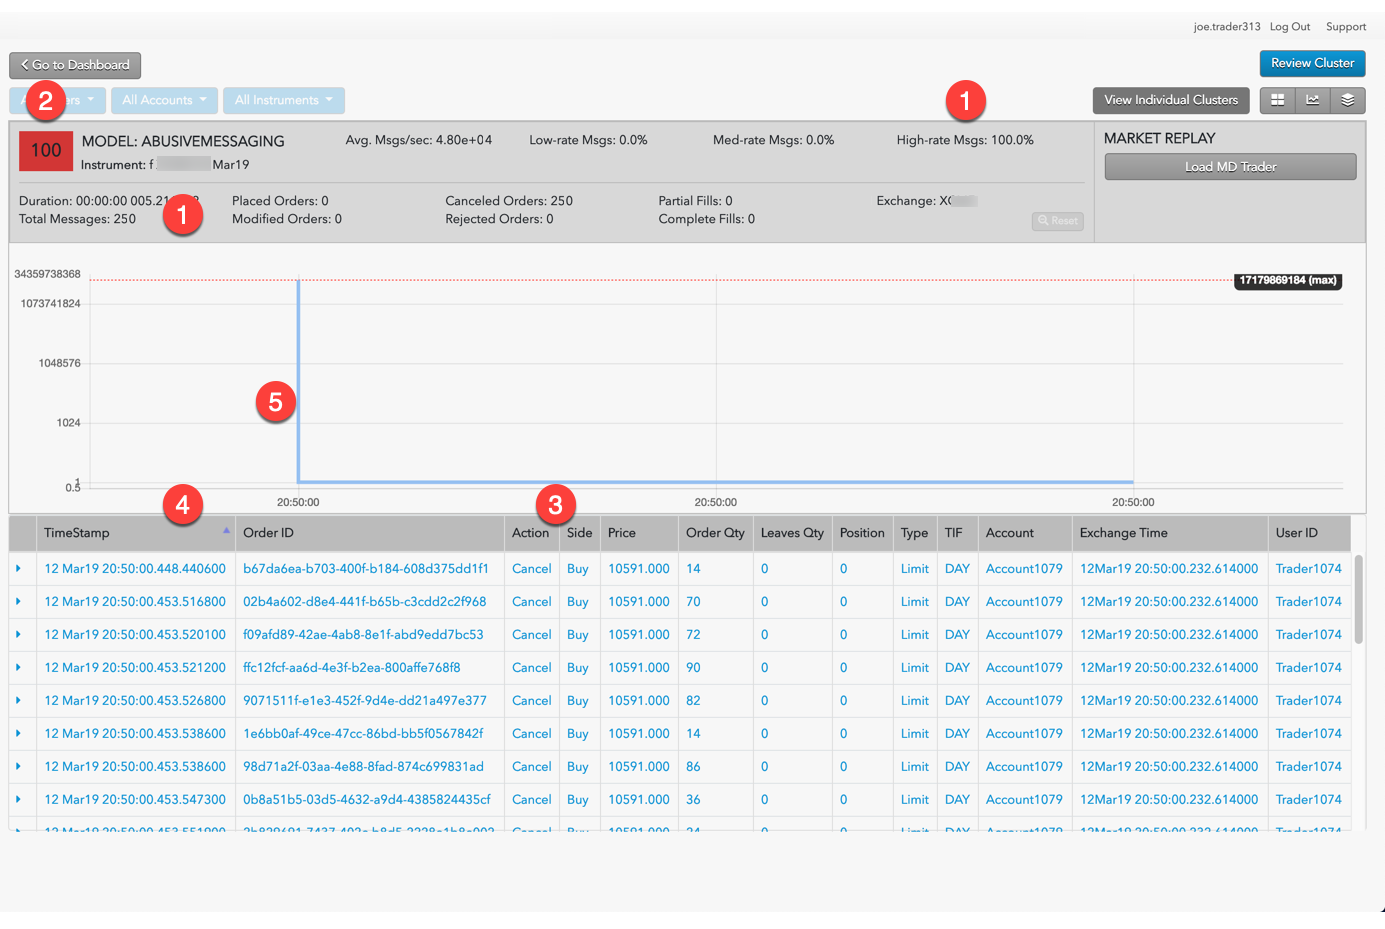
  1. In just over five one-thousandth’s of a second, the trader submitted over 25 order messages, 100% of which were considered to be submitted at a high rate.
  2. The meter indicates this cluster has a risk score of 100.
  3. The trader repeatedly submitted the same type of order.
  4. The exchange times indicated the messages were sent in micro-second intervals.
  5. The Burst Chart shows that for the first six-tenths of a second, the trader submitted messages at a rate of nearly 5,000 messages per second.

Wash Trading

Use the Cluster Scorecard to get a closer look at the activity that triggered the wash trading score. The Cluster Scorecard shows activity that could constitute a wash trade.

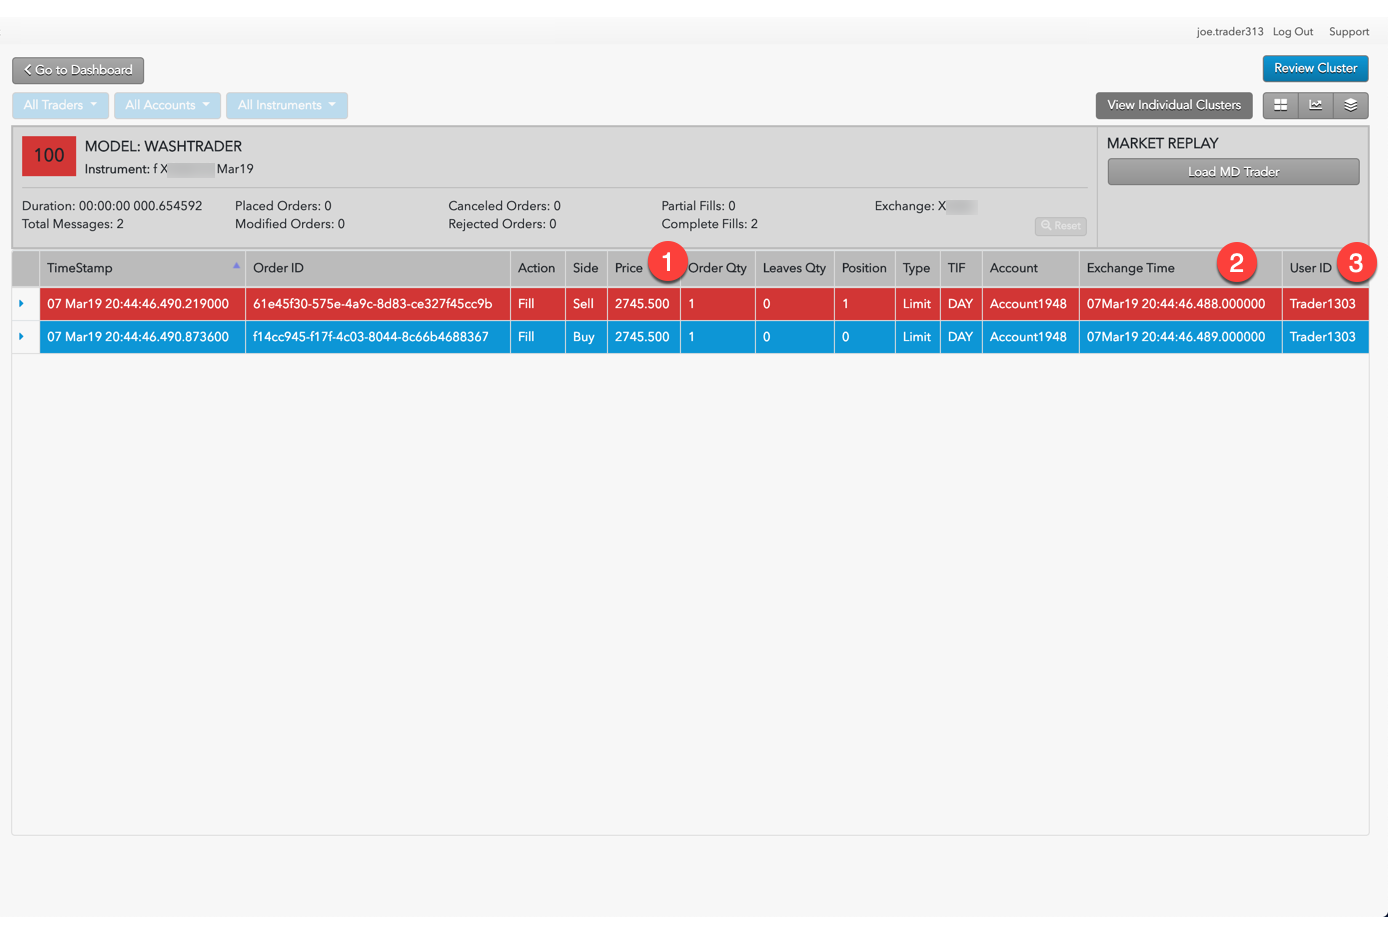
  1. Fills were executed on opposite sides of the market for the same order quantity.
  2. The two transactions were executed within the same millisecond.
  3. The two transactions were executed by the same trader ID.

Momentum Ignition

When investigating Momentum Ignition clusters with TT Trade Surveillance, you should focus on the:

  • Number of distinct price levels used by aggressive orders.
  • Quantity filled on the aggressive orders.
  • Quantity filled on the opposite, or profit-taking, orders.

For example, if the Igniter Price Levels and the Ignites (Vol) metrics display large values, this indicates that the trader may have been attempting to ignite a price movement in a particular direction (buy or sell) in order to mislead other market participants or to create an artificial price. The Opp. Side (Vol) is a good indicator of whether or not the trader received advantageous fills on orders opposite the igniter orders that the trader would not have otherwise received without intentionally or recklessly sparking the price movement.

The order audit trail data on the Statistics Scorecard can then be used to verify all of the order information and the timing of the activity that was identified as potential Momentum Ignition.

The activity can then also be replayed with the Market Replay on the Cluster Scorecard.

Pinging

Use the Cluster Scorecard to get a closer look at the activity that triggered the pinging score, focusing on the audit trail:

  • Review the audit trail for the creation of a series of small new orders at various price levels followed almost immediately by cancel events.
  • Look for a change in trader behavior once the small orders begin to fill immediately after order entry. Specifically, look for larger aggressively priced orders being entered on the opposite side of the market (as the small orders) as soon as the small orders get filled. The use of a hyper-marketable limit order or a market order could be indicative of aggressive orders.
  • Look in the audit trail to see if that aggressive order was filled and was followed by an even larger order on the same side of the market as the original small orders were placed.
  • Compare the fill price of the final large order to that of the fill of the last small ping order. If the final large order filled at a better price than the original small ping orders, then it is likely that an abusive pinging occurred.
This site is registered on wpml.org as a development site. Switch to a production site key to remove this banner.